
KPIs — The Vital Signs of Your Organization.
Track the vital signs of your organization with calculated indicators. KPIs read their own definitions, format themselves correctly, and carry targets, thresholds, and trend context on every card.
What makes it work
Purpose-built for leaders who need clarity without complexity.
Calculated Indicators
Build KPIs from the metrics you already collect — ratios, rates, per-capita figures — with formulas that recalculate as new data lands.
Smart Formatting
Ratios display as '3:1', percentages as '85%', currency in your locale. Elairo reads the KPI definition and formats every tile correctly.
Targets and Thresholds
Set goals and healthy ranges so a number arrives with a verdict attached, not just a value to interpret.
Tavi proposes the indicator and the formula
Say what you want to measure in plain language. Tavi proposes the indicator, the formula, and the tracking cadence for you to approve.
Tavi Performance Insights
Tavi reads your whole KPI portfolio and tells you where to look first — so a review starts with the conversation that matters instead of a hunt through dashboards.
One portfolio health score
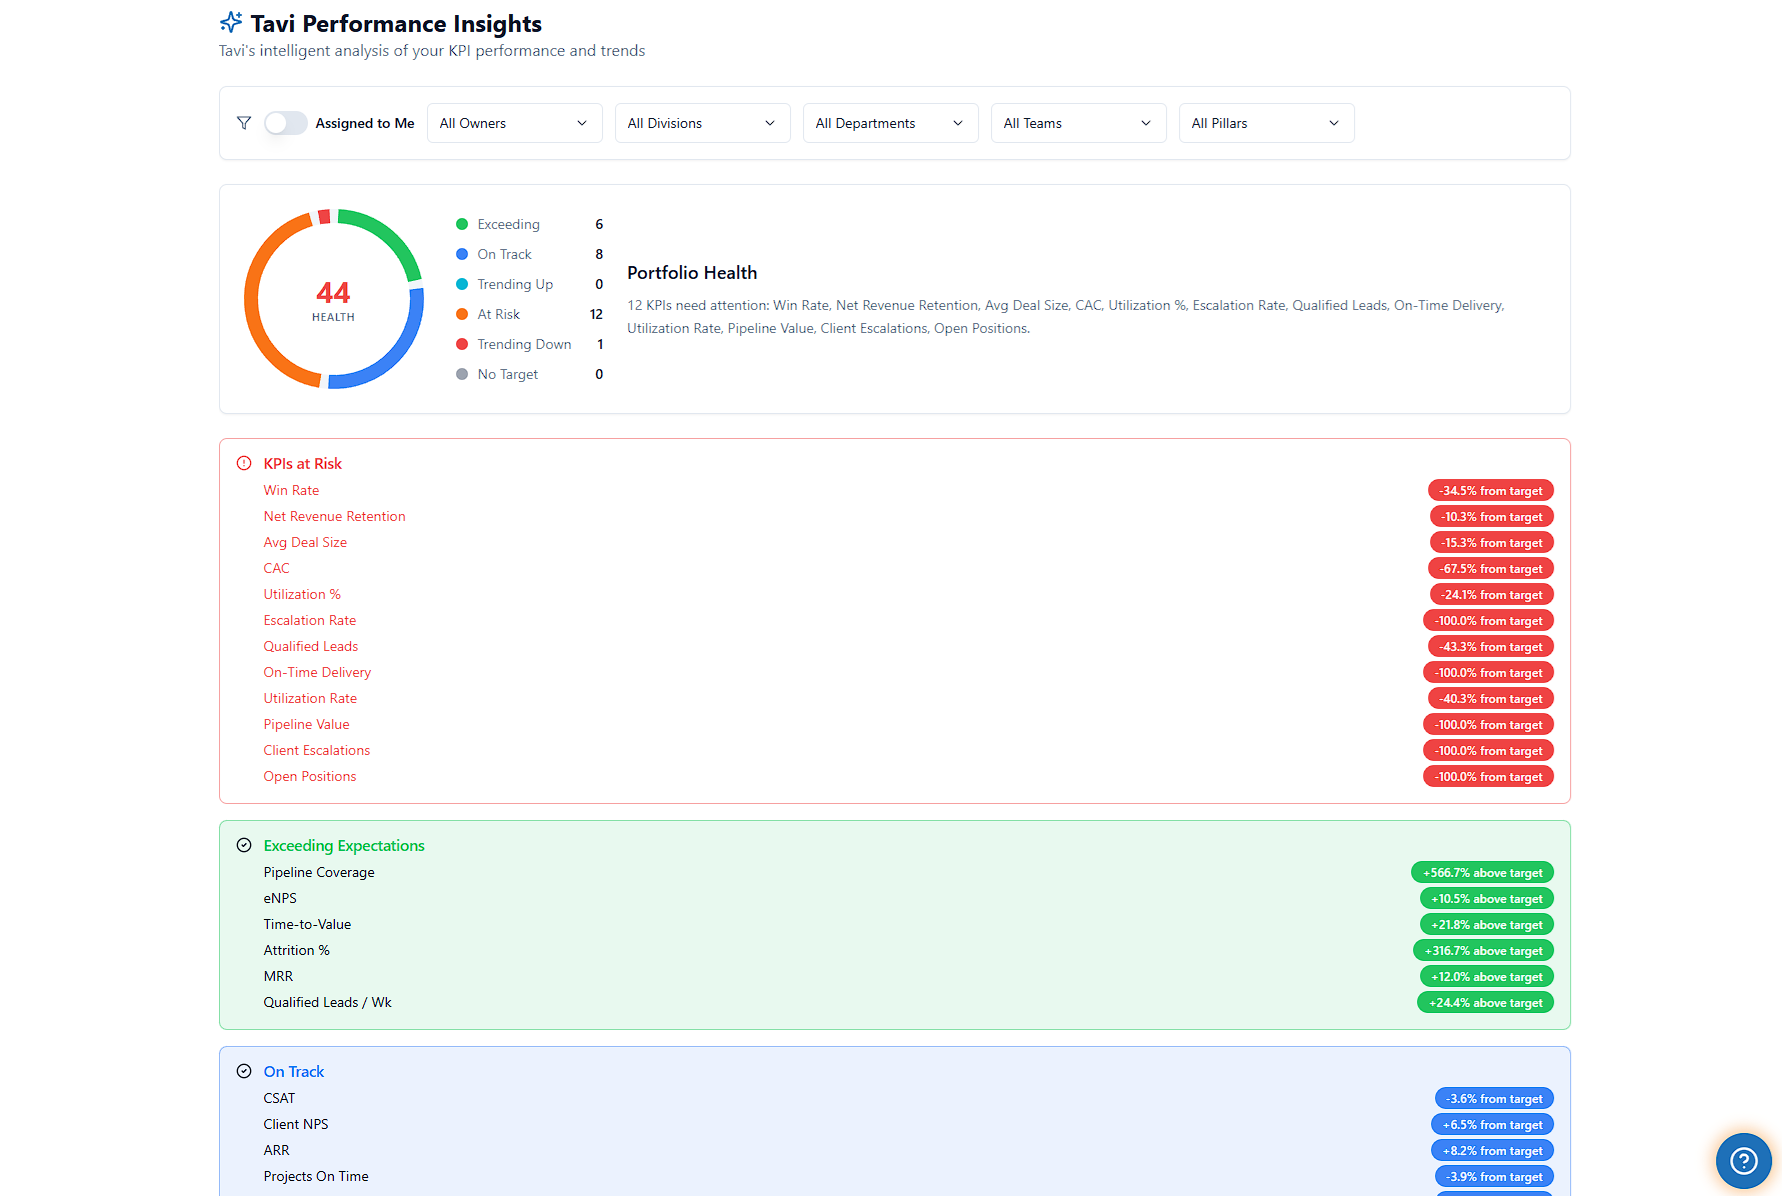
A single number summarizing every KPI you track, with the breakdown behind it — exceeding, on track, at risk, and trending.
Attention list first
Tavi names the indicators that need a decision this week, in priority order, so nothing quietly drifts for a quarter.
Variance on every line
Each KPI shows how far it sits from target in plain percentages, grouped by at risk, exceeding, and on track.
Slice it your way
Filter insights by owner, division, department, team, or pillar — or narrow to just what's assigned to you.
The Elairo KPI Insight Card™
One card that tells you the number, the direction, and whether it actually matters — before anyone has to open a spreadsheet.
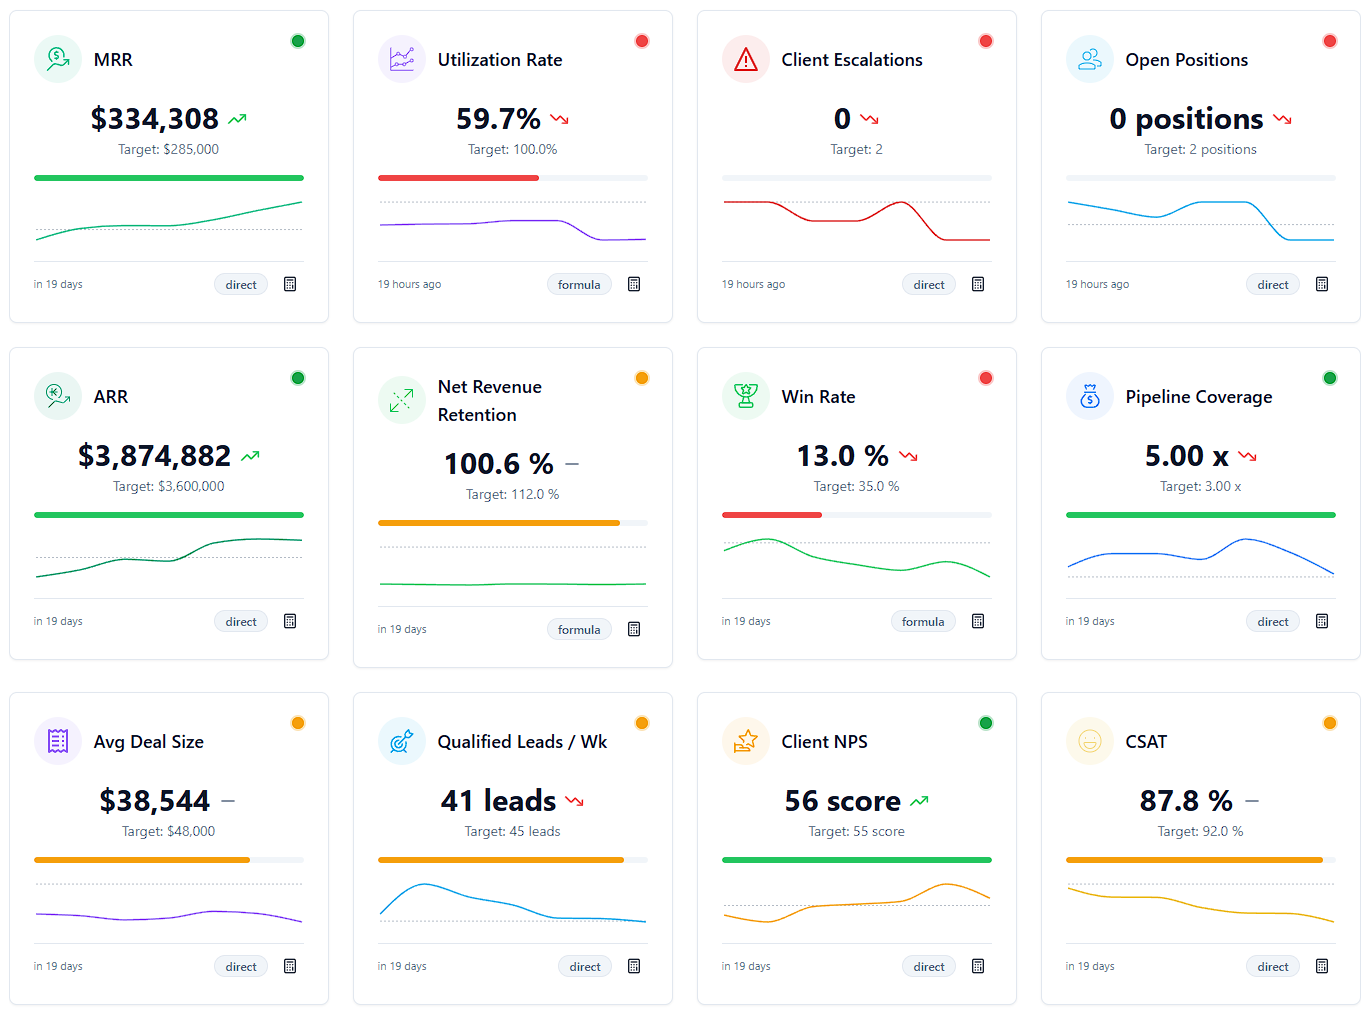
Most dashboards hand you a number and walk away. The Elairo KPI Insight Card™ hands you a read. Current value, target, trend, progress, and a plain-language status — all decided by rules you set, not by a guess. It's the same card on your dashboard, on the wall display, and in the leader's weekly view, so everyone is looking at the same truth.
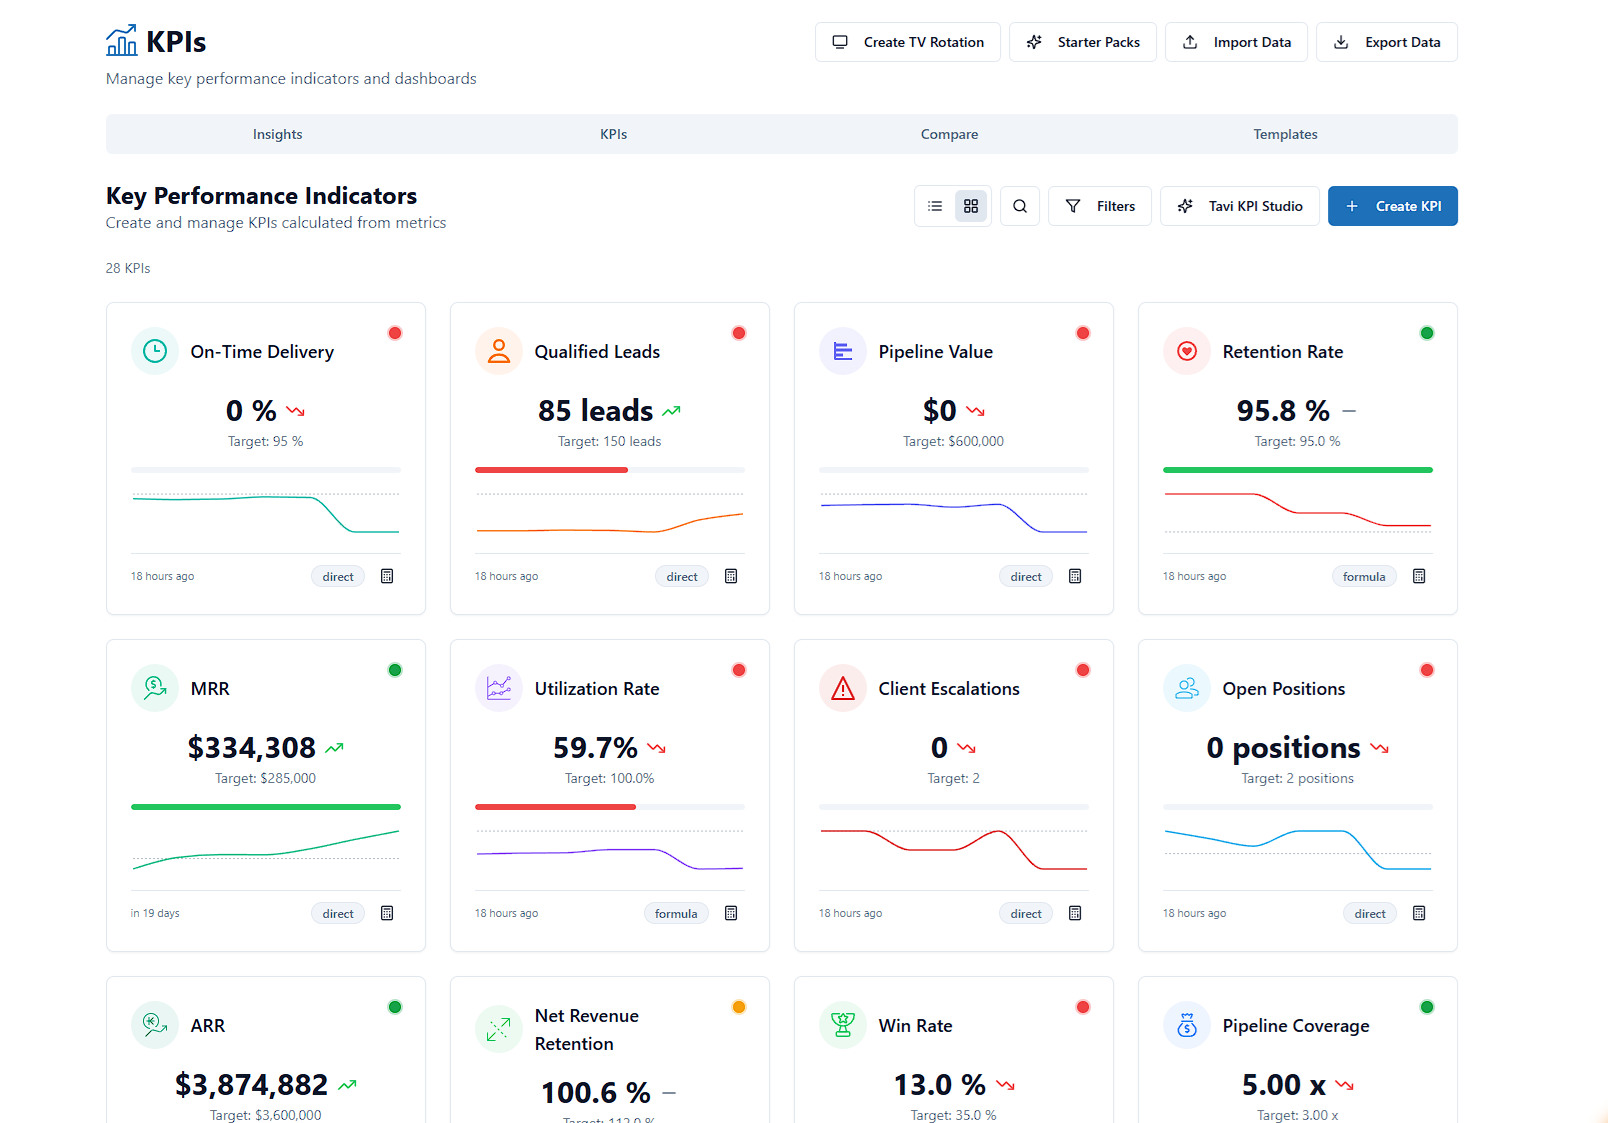
Looking to express your KPIs through traditional charts and graphs? We have you covered.
Status you can trust, every time
On track, at risk, ahead, or off pace. The status is calculated from your own targets and zones, not inferred. Change the goal and the zones recalibrate with it.
It knows when a gap is on purpose
Holiday weeks, closed campuses, seasonal pauses. Mark a period as a planned break and the card leaves an honest gap instead of a fake zero. No false alarms, no broken streaks.
Trend and history at a glance
A built-in sparkline shows where the number has been, how fast it's moving, and whether that direction is good news for this particular metric.
An AI note that refuses to speculate
Turn on the optional AI line and you get one short sentence grounded only in that card's real numbers. Every sentence is checked before it's shown: no advice, no causes invented, no figures that aren't in your data. If it can't say something true, it says nothing.
- Stale data flags itself instead of quietly aging
- Works on TV mode, mobile, and shared links without changing meaning
- Your data stays inside your organization — always
Connected to everything else
Every module in Elairo shares the same data layer. Goals inform work. Meetings produce action items. Metrics feed KPIs. Reviews feed development plans. Nothing lives in a silo.
See it for your team
Start a free trial or book a personalized demo with our team.