
Dashboards — Built for the Room You're In.
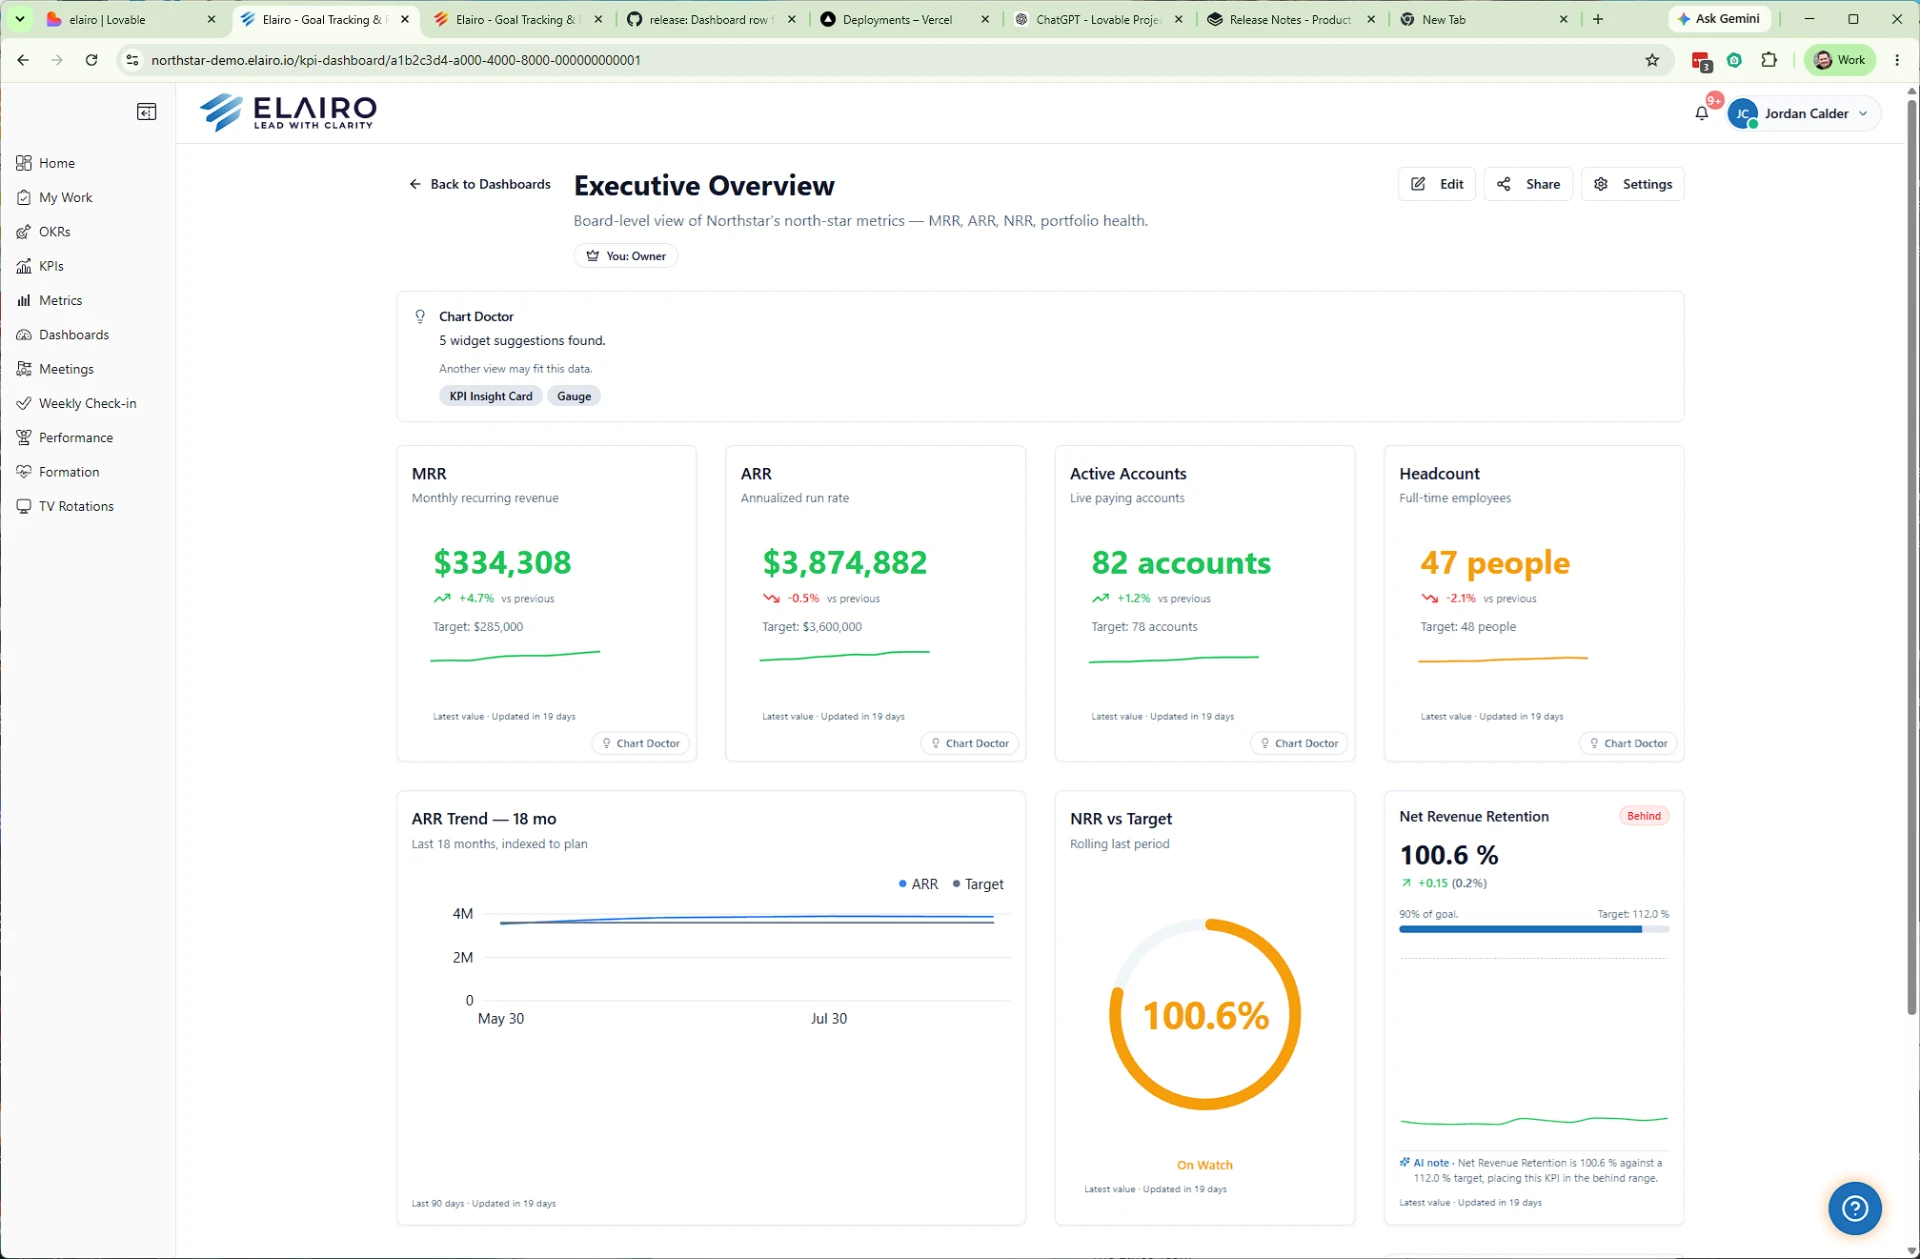
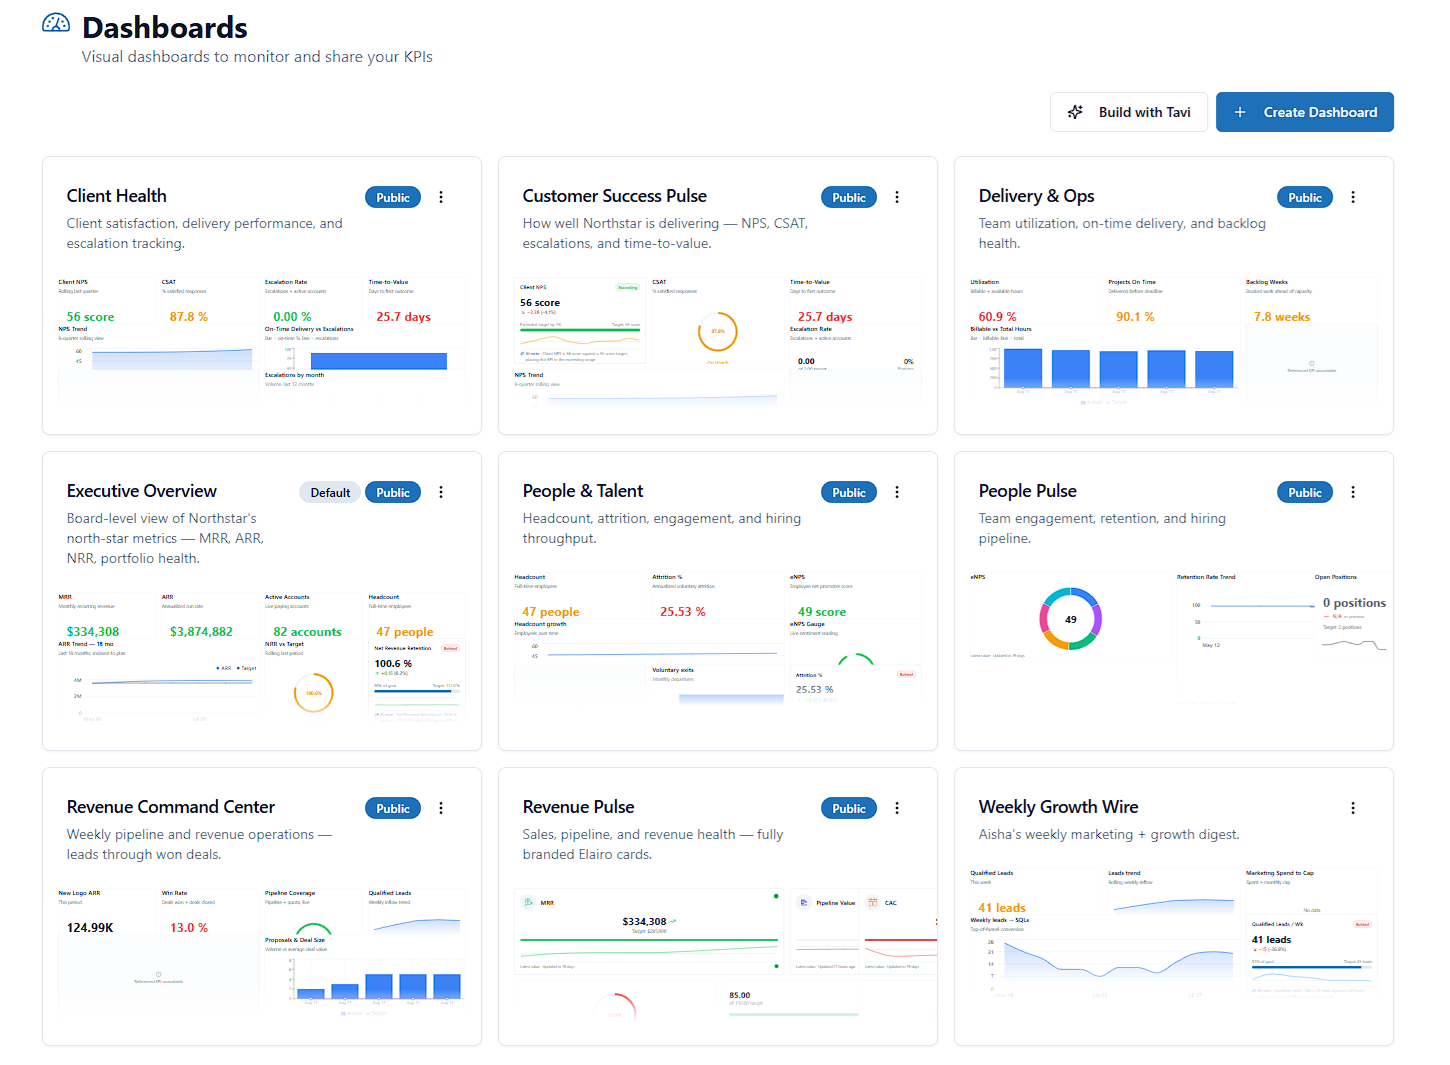
Visual dashboards to monitor and share your KPIs. Pick the widgets, arrange the grid, and give every audience — board, staff, campus — exactly the view they need.
What makes it work
Purpose-built for leaders who need clarity without complexity.
Widgets That Fit the Metric
Gauges for ratios, line charts for trends, headline numbers for the figure everyone asks about — each widget configured for its data type.
Flexible Grid Layouts
Drag, resize, and group tiles until the dashboard reads at a glance on a laptop or across a room.
Share With the Right People
Publish dashboards to teams and leaders, or send them to a display rotation for everyone to see.
Tavi composes the whole dashboard
"Executive dashboard for our weekly leadership meeting." Tavi picks the KPIs, chooses the right chart for each, lays it out, and shows you a live preview to approve.
Connected to everything else
Every module in Elairo shares the same data layer. Goals inform work. Meetings produce action items. Metrics feed KPIs. Reviews feed development plans. Nothing lives in a silo.
See it for your team
Start a free trial or book a personalized demo with our team.